Private beta
From ticker to investment committee report in a minute
Type a US ticker. Equity engine reads the SEC filings, scores the company against its sector and closest peers, sets it in the macro picture and writes an analysis where every number is checked and every claim cites its source.
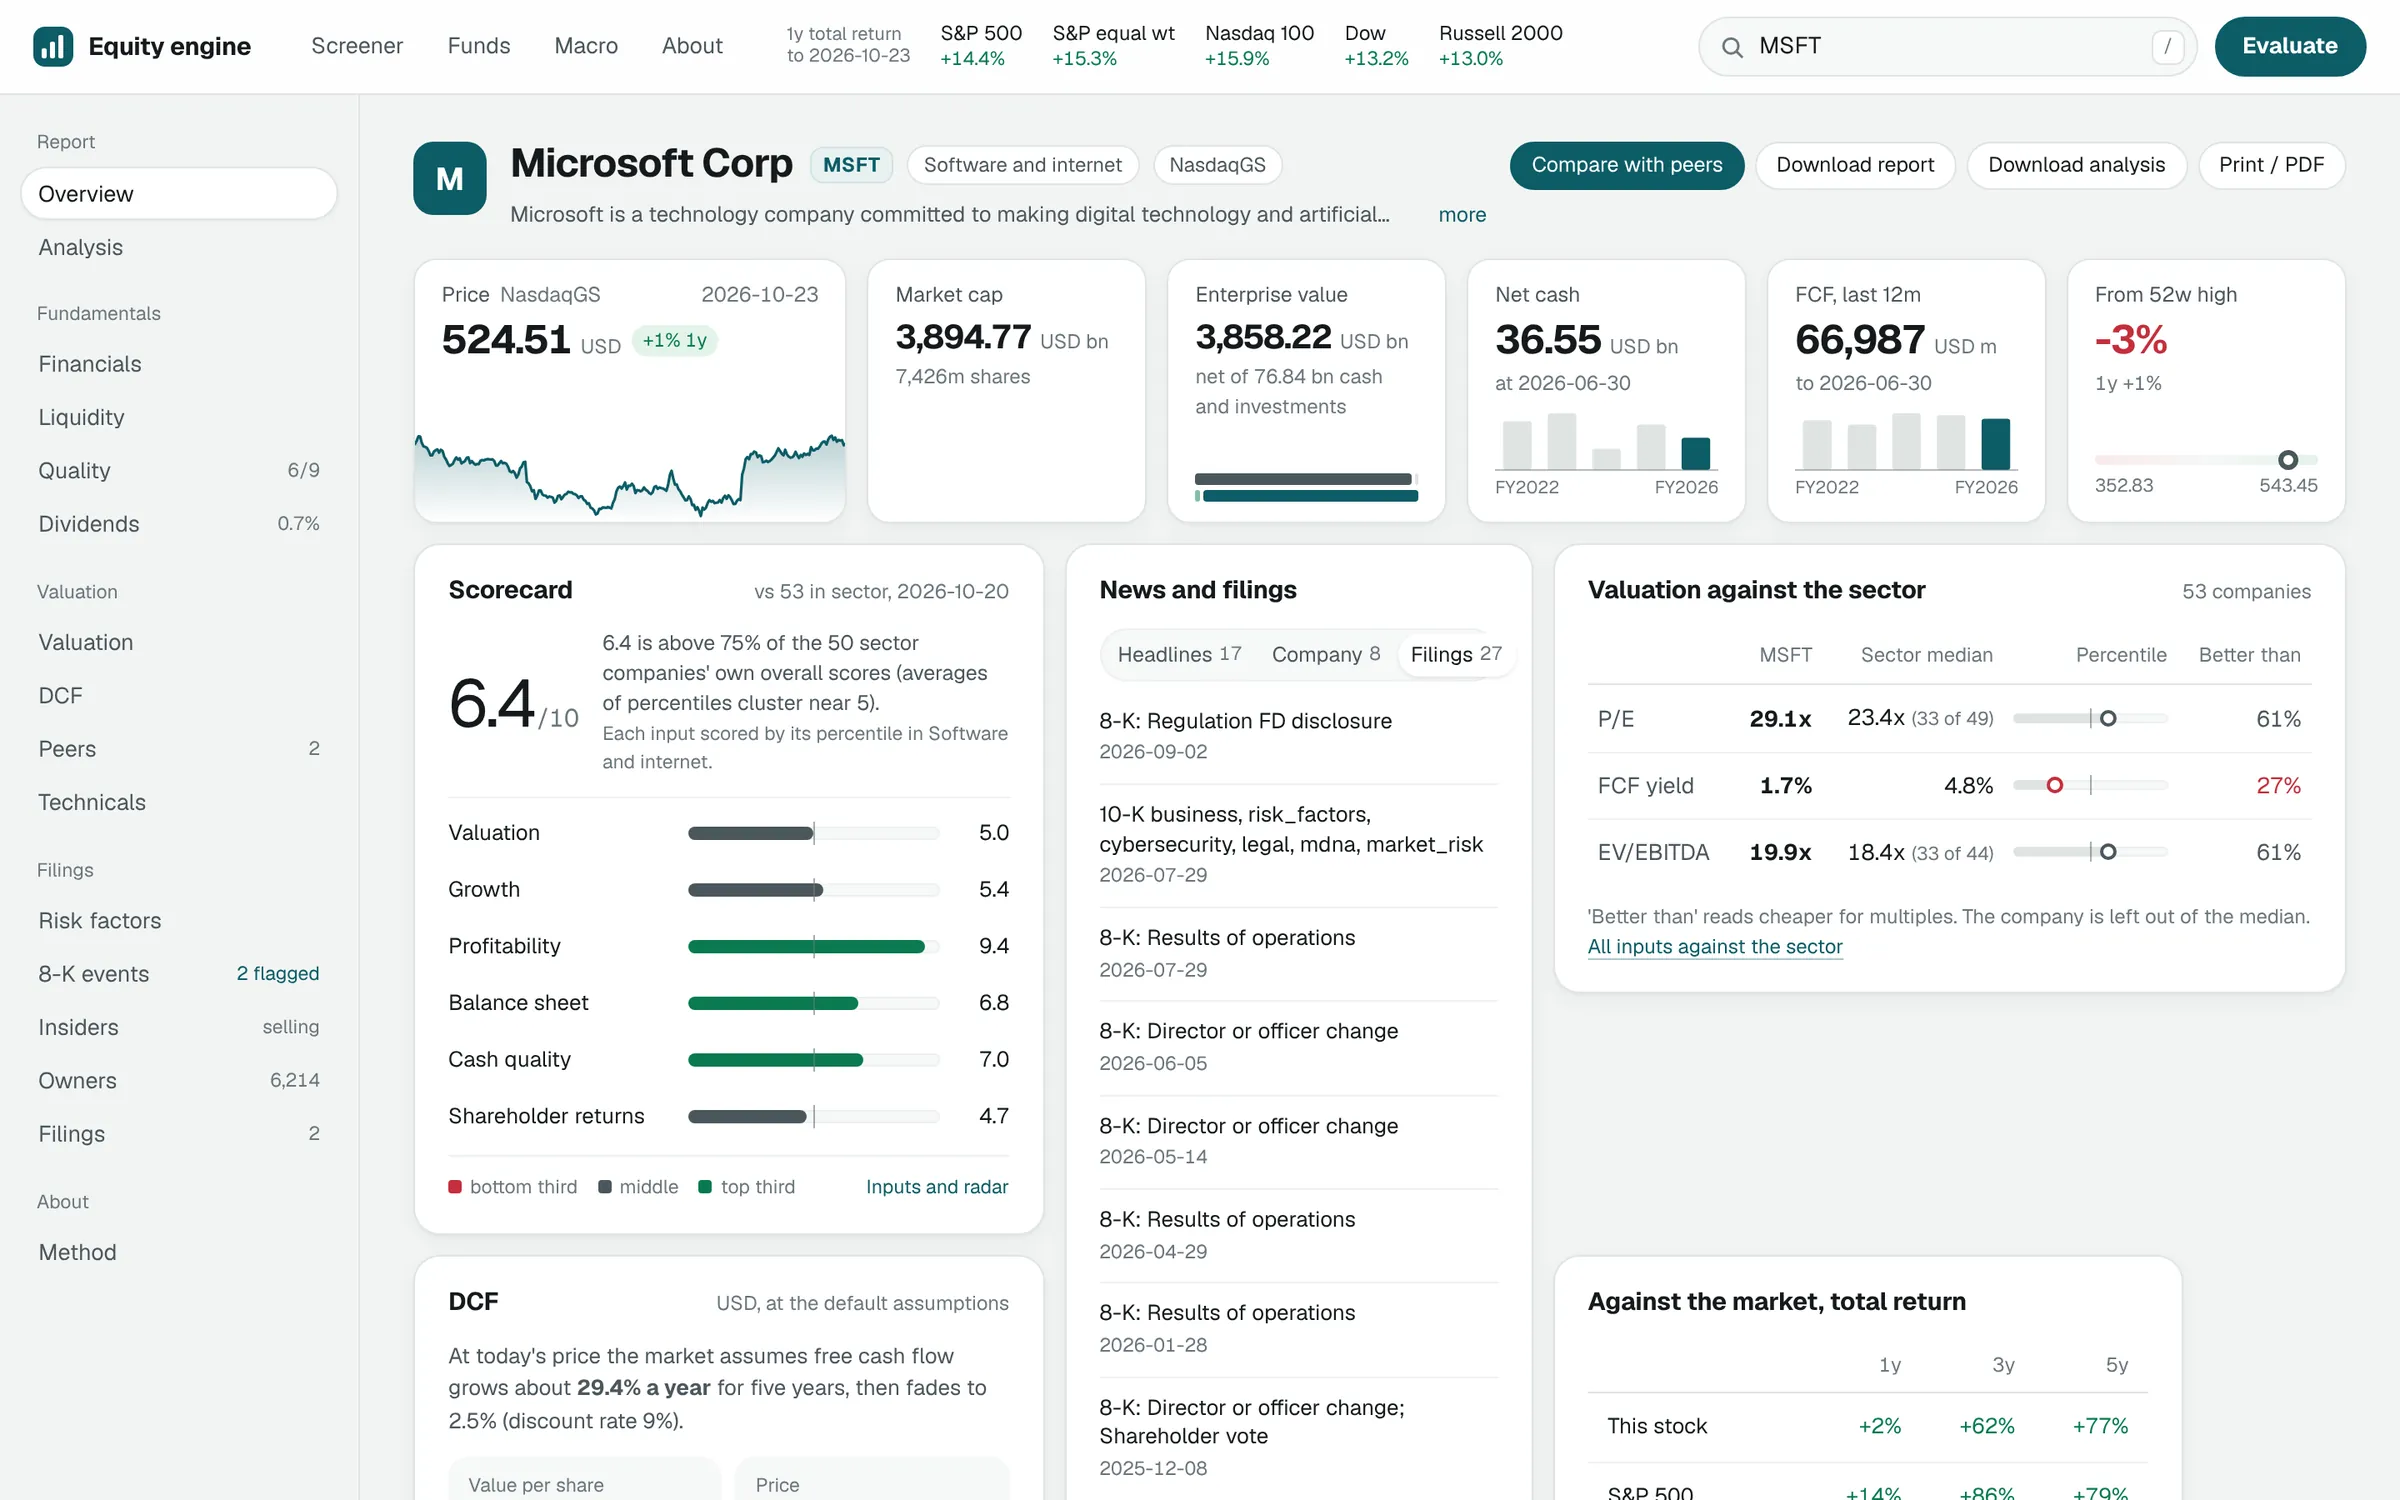
Screenshot is illustrative. Not investment advice.
What you get
One report, built the way an investment committee reads a company
Everything comes from primary sources and is dated, so you can check it before you rely on it.
Every figure from the filing
Revenue, margins, cash quality and the balance sheet, built from 10-K, 10-Q and 8-K filings. Each number links to the filing it came from.
Sector and peers
The company scored against its sector and closest peers, input by input, plus a sector screener to see the whole group.
Valuation and DCF
Multiples against the sector median and the company's own history, and a DCF where the business fits one, with assumptions you can move.
Ownership and insiders
Insider trades from Form 4 and institutional owners from 13F. Open-market trades are kept apart from awards and plan sales.
Risk factor changes
What is new, rewritten or removed in the risk factors since last year's annual report, next to recent 8-K events.
Macro context
Rates, the yield curve, inflation, credit spreads and sector returns, each reading dated and sourced.
How it works
Rules first, AI second.
The model writes, it does not invent.
- 01
Rules build the evidence
Every figure is computed by code from SEC filings and market data, with its filing and period attached. No model touches the numbers.
- 02
The model writes from that evidence only
The analysis is drafted from the report's own data: the case for, the case against, and what would change the view.
- 03
Every number is checked, every claim cites its source
Each figure in the text is matched to the data. An independent checker reads every sentence against the sources it cites.
- 04
What fails is shown on the page
Sentences that fail the checks are removed and listed at the end of the analysis, so you see what was cut and why.
Inside the product
Reports, screens and macro in one place
Screenshots are illustrative. Not investment advice.
Who it is for
For people who read filings for a living
Equity investors
Get to a view on a US-listed company faster, with every number and filing one click away.
Analysts
Skip the spreadsheet set-up. Start from a sourced report and spend the time on judgement.
PE and VC teams
Public comps and due diligence on listed peers, laid out the way a deal team reads a company.
Built from 14 years in corporate finance and venture capital. Equity engine started as a due diligence engine for private equity.
Private beta
Request beta access
Access is on request while the beta is small. Tell us a little about how you work and we will reply by email.
- / US-listed companies only
- / No payment details needed
- / Not investment advice
Built at tigen.dev by Tomasz Głowacki. US-listed companies only. Not investment advice.